MA Thesis Research
Marin County, California
Wildfire Risk Analysis · Environmental GIS

Spatial Analysis · Environmental GIS · Thematic Cartography

Wildfire
Probability
Analysis

MA Capstone research examining the environmental drivers of wildfire occurrence in Marin County, California — combining multi-layer raster analysis, WUI modeling, linear regression, and FEMA National Risk Index validation to produce thematic wildfire probability maps.

ArcGIS Pro GeoDa Raster Analysis Marin County, CA MA Thesis · 2022
// Wildfire risk zone — Marin County schematic
WUI BOUNDARY High Risk Zone Moderate Risk Historical Fire N 10 km
Study Area
Marin County, CA
Time Period
1920s – 2020
Fire Points Analyzed
222 Thermal Anomalies
Variables Modeled
7 Environmental Factors
01 — Project Overview

Mapping Wildfire Risk
in Marin County

Marin County sits at the intersection of mountainous terrain, dense native forests, shrubland, and one of California's most populated coastal corridors — making it uniquely vulnerable to the compounding effects of climate change and historic fire suppression. This MA capstone research investigated which environmental factors most strongly correlate with wildfire occurrence and assessed how accurately FEMA's National Risk Index (NRI) predicts historical fire patterns.

Using ArcGIS Pro as the primary platform, I constructed a multi-layer raster analysis pipeline that integrated seven environmental stress variables — precipitation, temperature, soil moisture, drought index, elevation, wind, and land cover — into a Boolean wildfire probability raster for Marin County. This was refined using Wildland-Urban Interface (WUI) data to prioritize high-risk areas near populated zones, and validated against a historical fire boundaries dataset spanning from the 1920s to 2020.

A linear regression analysis, conducted in GeoDa, then correlated 222 MODIS thermal anomaly points against all seven environmental variables to statistically identify which factors had the strongest relationship to actual fire occurrence.
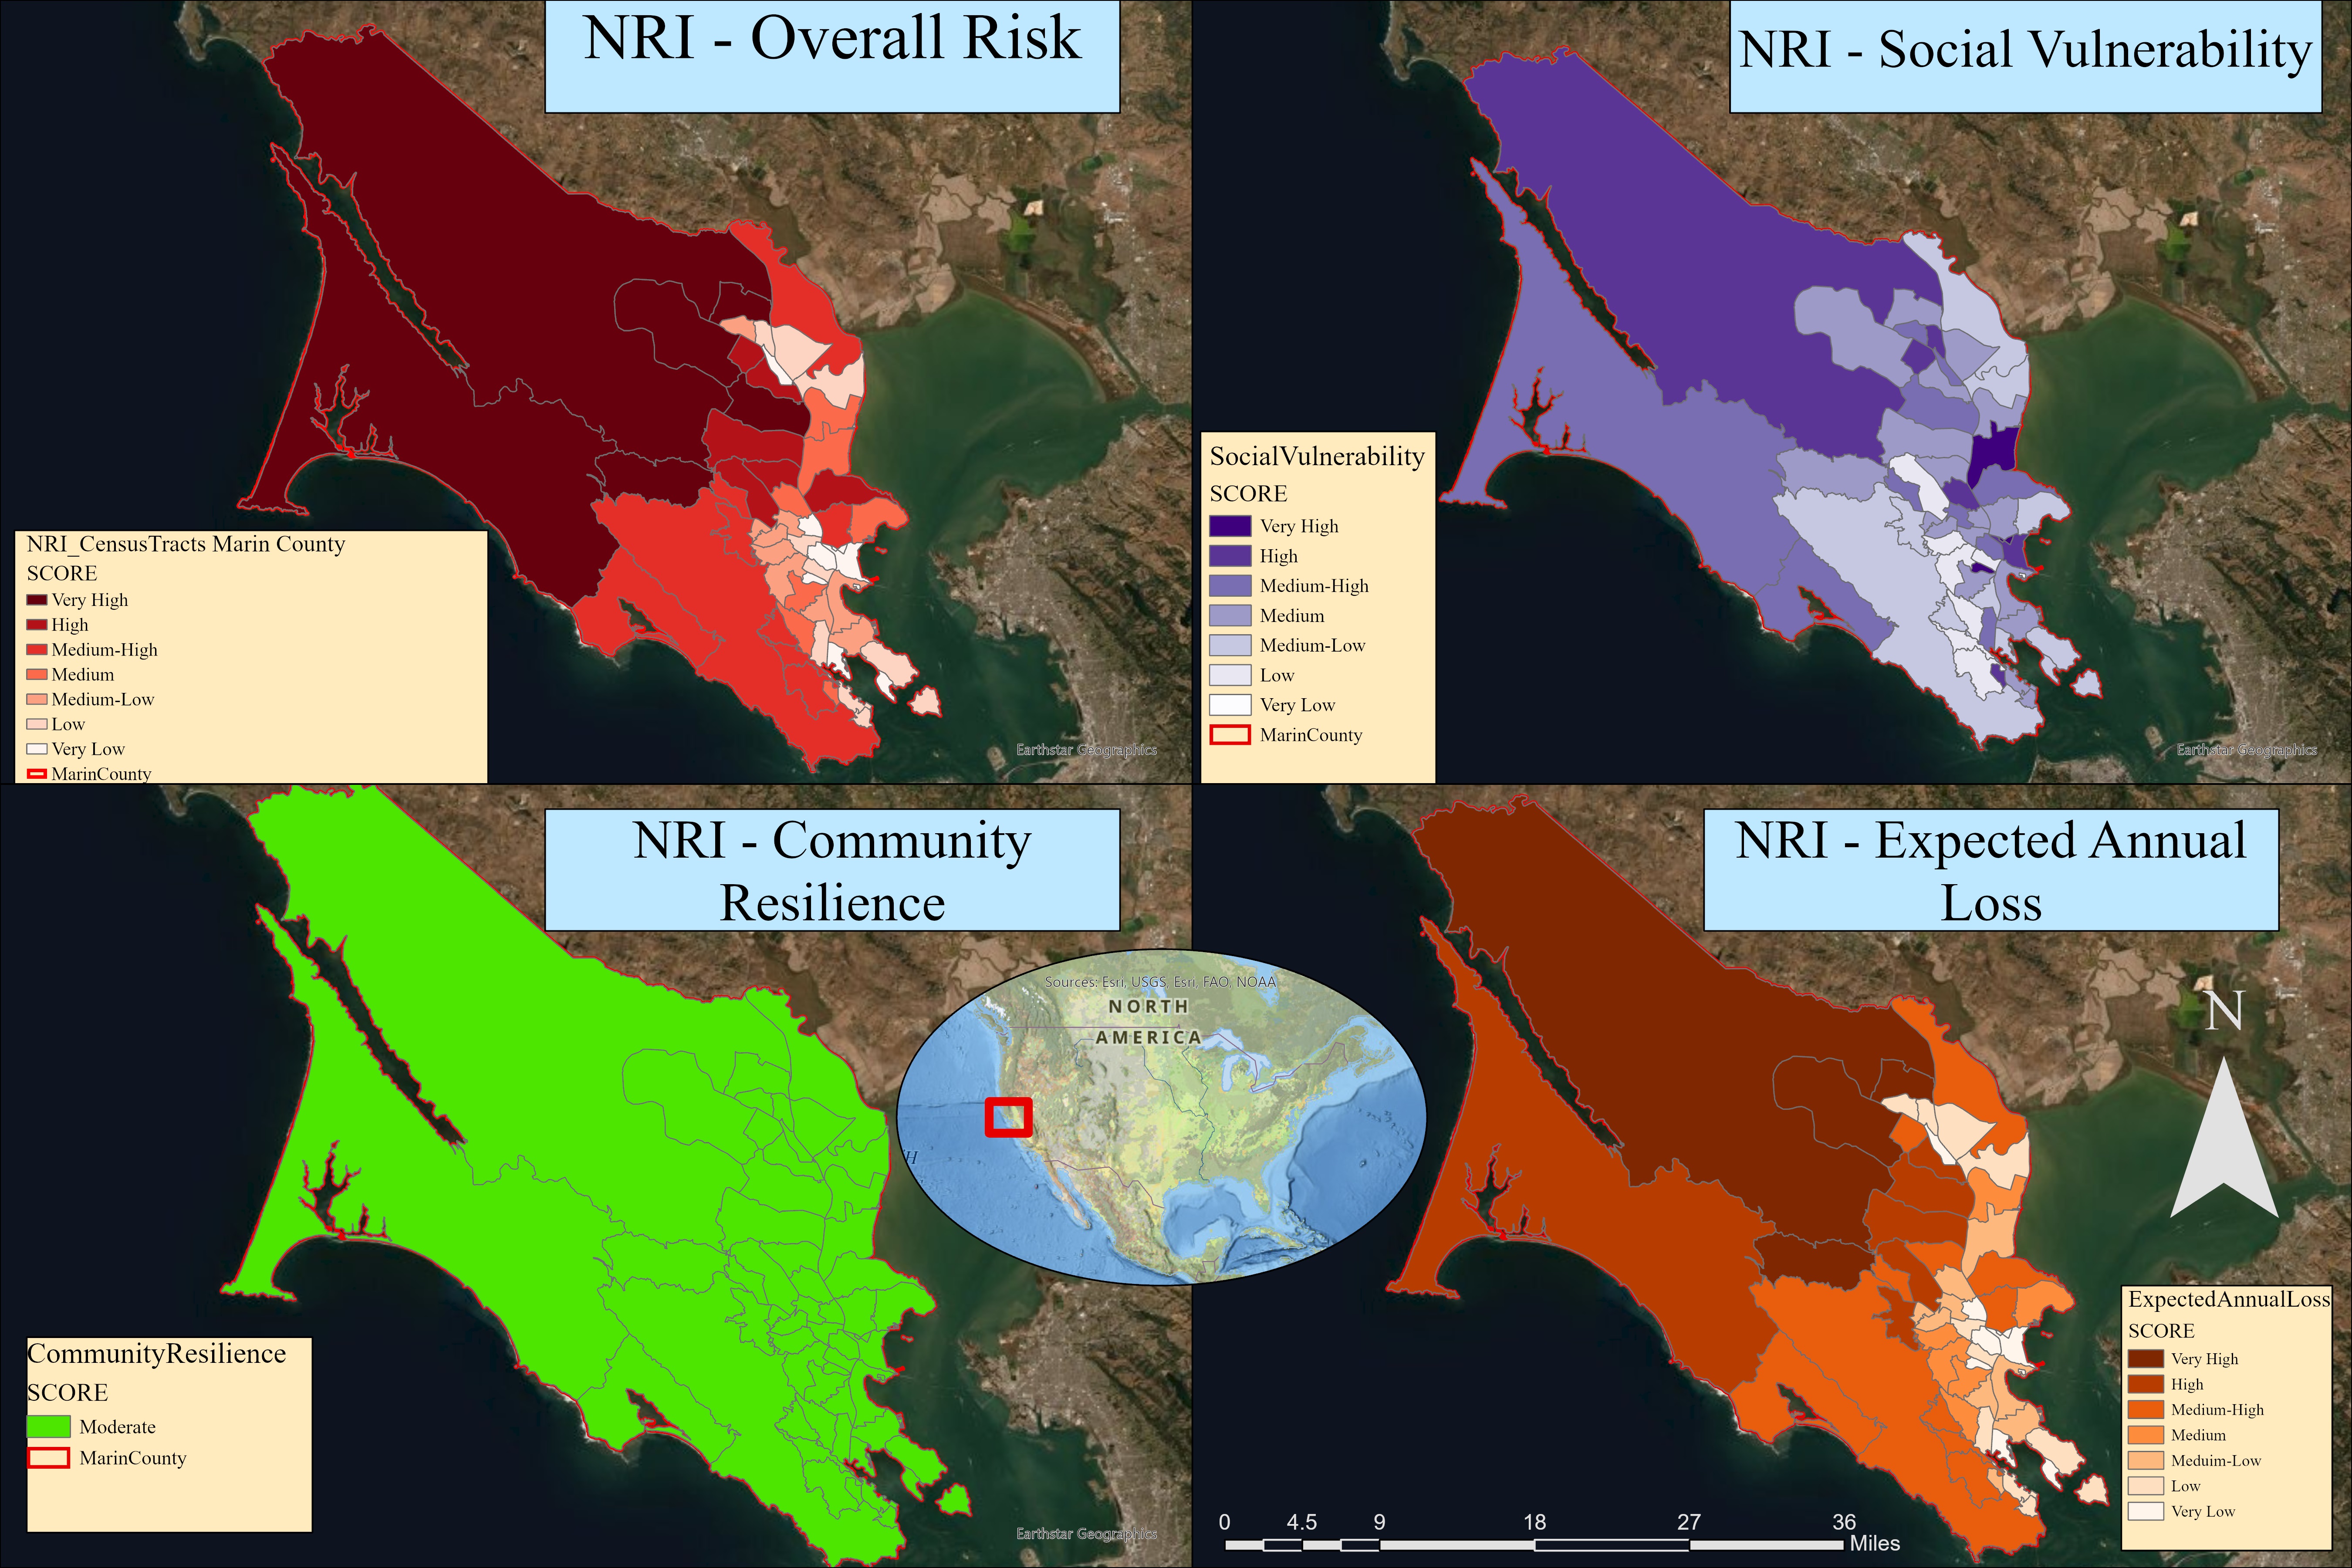
Marin County National Risk Index
Figure 1 — Marin County National Risk Index (NRI) · FEMA Census Tract Analysis · Displaying Expected Annual Loss, Social Vulnerability, Community Resilience, and Overall Risk scores across the region.
02 — Research Questions

Three Core
Questions

Question 01
Which environmental factors contribute to wildfire occurrence?
Examined precipitation, temperature, drought index, soil moisture, elevation, wind speed, and vegetation land cover as potential wildfire-promoting variables across Marin County's varied terrain.
Question 02
How accurately does FEMA's NRI predict historical fire patterns?
Compared the National Risk Index's wildfire probability predictions against actual FRAP-recorded fire boundaries from the 1920s through 2020 to assess alignment between risk model and historical reality.
Question 03
How can risk-response coordination be improved?
Used findings from Q1 and Q2 to recommend enhancements to Marin County fire management strategy, prioritizing WUI zones and improving dataset resolution for future predictive modeling.
03 — Methodology

The Analytical
Pipeline

Step 01 — Data Acquisition
Multi-Source Environmental Dataset Assembly

Assembled seven environmental datasets across raster and vector formats from national and local sources: precipitation and temperature rasters at 4km resolution from PRISM; a 1m DEM and 100m wind raster from USGS and Global Wind Atlas; soil moisture vectors from USDA NRCS; land cover from the Golden Gate National Parks Conservancy; and drought index vectors from FEMA. MODIS thermal anomaly points (2018–2020) served as the fire occurrence dataset, filtered to 222 confirmed points within Marin County.

Step 02 — Data Preparation
Clip, Select by Attribute & Vector-to-Raster Conversion

Each dataset was clipped to the Marin County boundary using the ArcGIS Pro Data Management Clip tool — with separate vector and raster versions applied to each format. Environmental stress thresholds were then isolated using Select by Attribute: soil moisture ≤20%, temperature ≥19°C, precipitation ≤10%, wind ≥7 (>50th percentile), and elevation ≤295m. Fire-prone land cover types (native/non-native forests, shrubland, cropland) were selected and exported as new layers. All vector layers were then converted to raster format at 50m cell size using Polygon to Raster for compatibility with the Raster Calculator.

Step 03 — Raster Math
Boolean Wildfire Probability Surface

Each environmental raster was processed through two rounds of Raster Calculator operations. Round 1 extracted Boolean layers (1 = stress condition present, 0 = absent) for each variable. Round 2 multiplied all layers together, producing a composite probability surface highlighting areas where all environmental stress factors converge. The DEM layer was retained at continuous values to enforce the elevation threshold. A second raster calculation incorporated the WUI dataset to narrow results to high-risk areas near populated zones.

Step 04 — Linear Regression
Spatial Regression in GeoDa

Environmental attribute values were spatially joined to the 222 MODIS thermal anomaly points: soil moisture, drought index, and land cover were joined via Spatial Join; temperature, precipitation, and wind values were manually entered per point due to raster format incompatibilities. Land cover types were translated to numerical factorial values to enable regression. The three annual TA point datasets (2018, 2019, 2020) were merged into a single shapefile and exported to GeoDa for ordinary least squares linear regression.

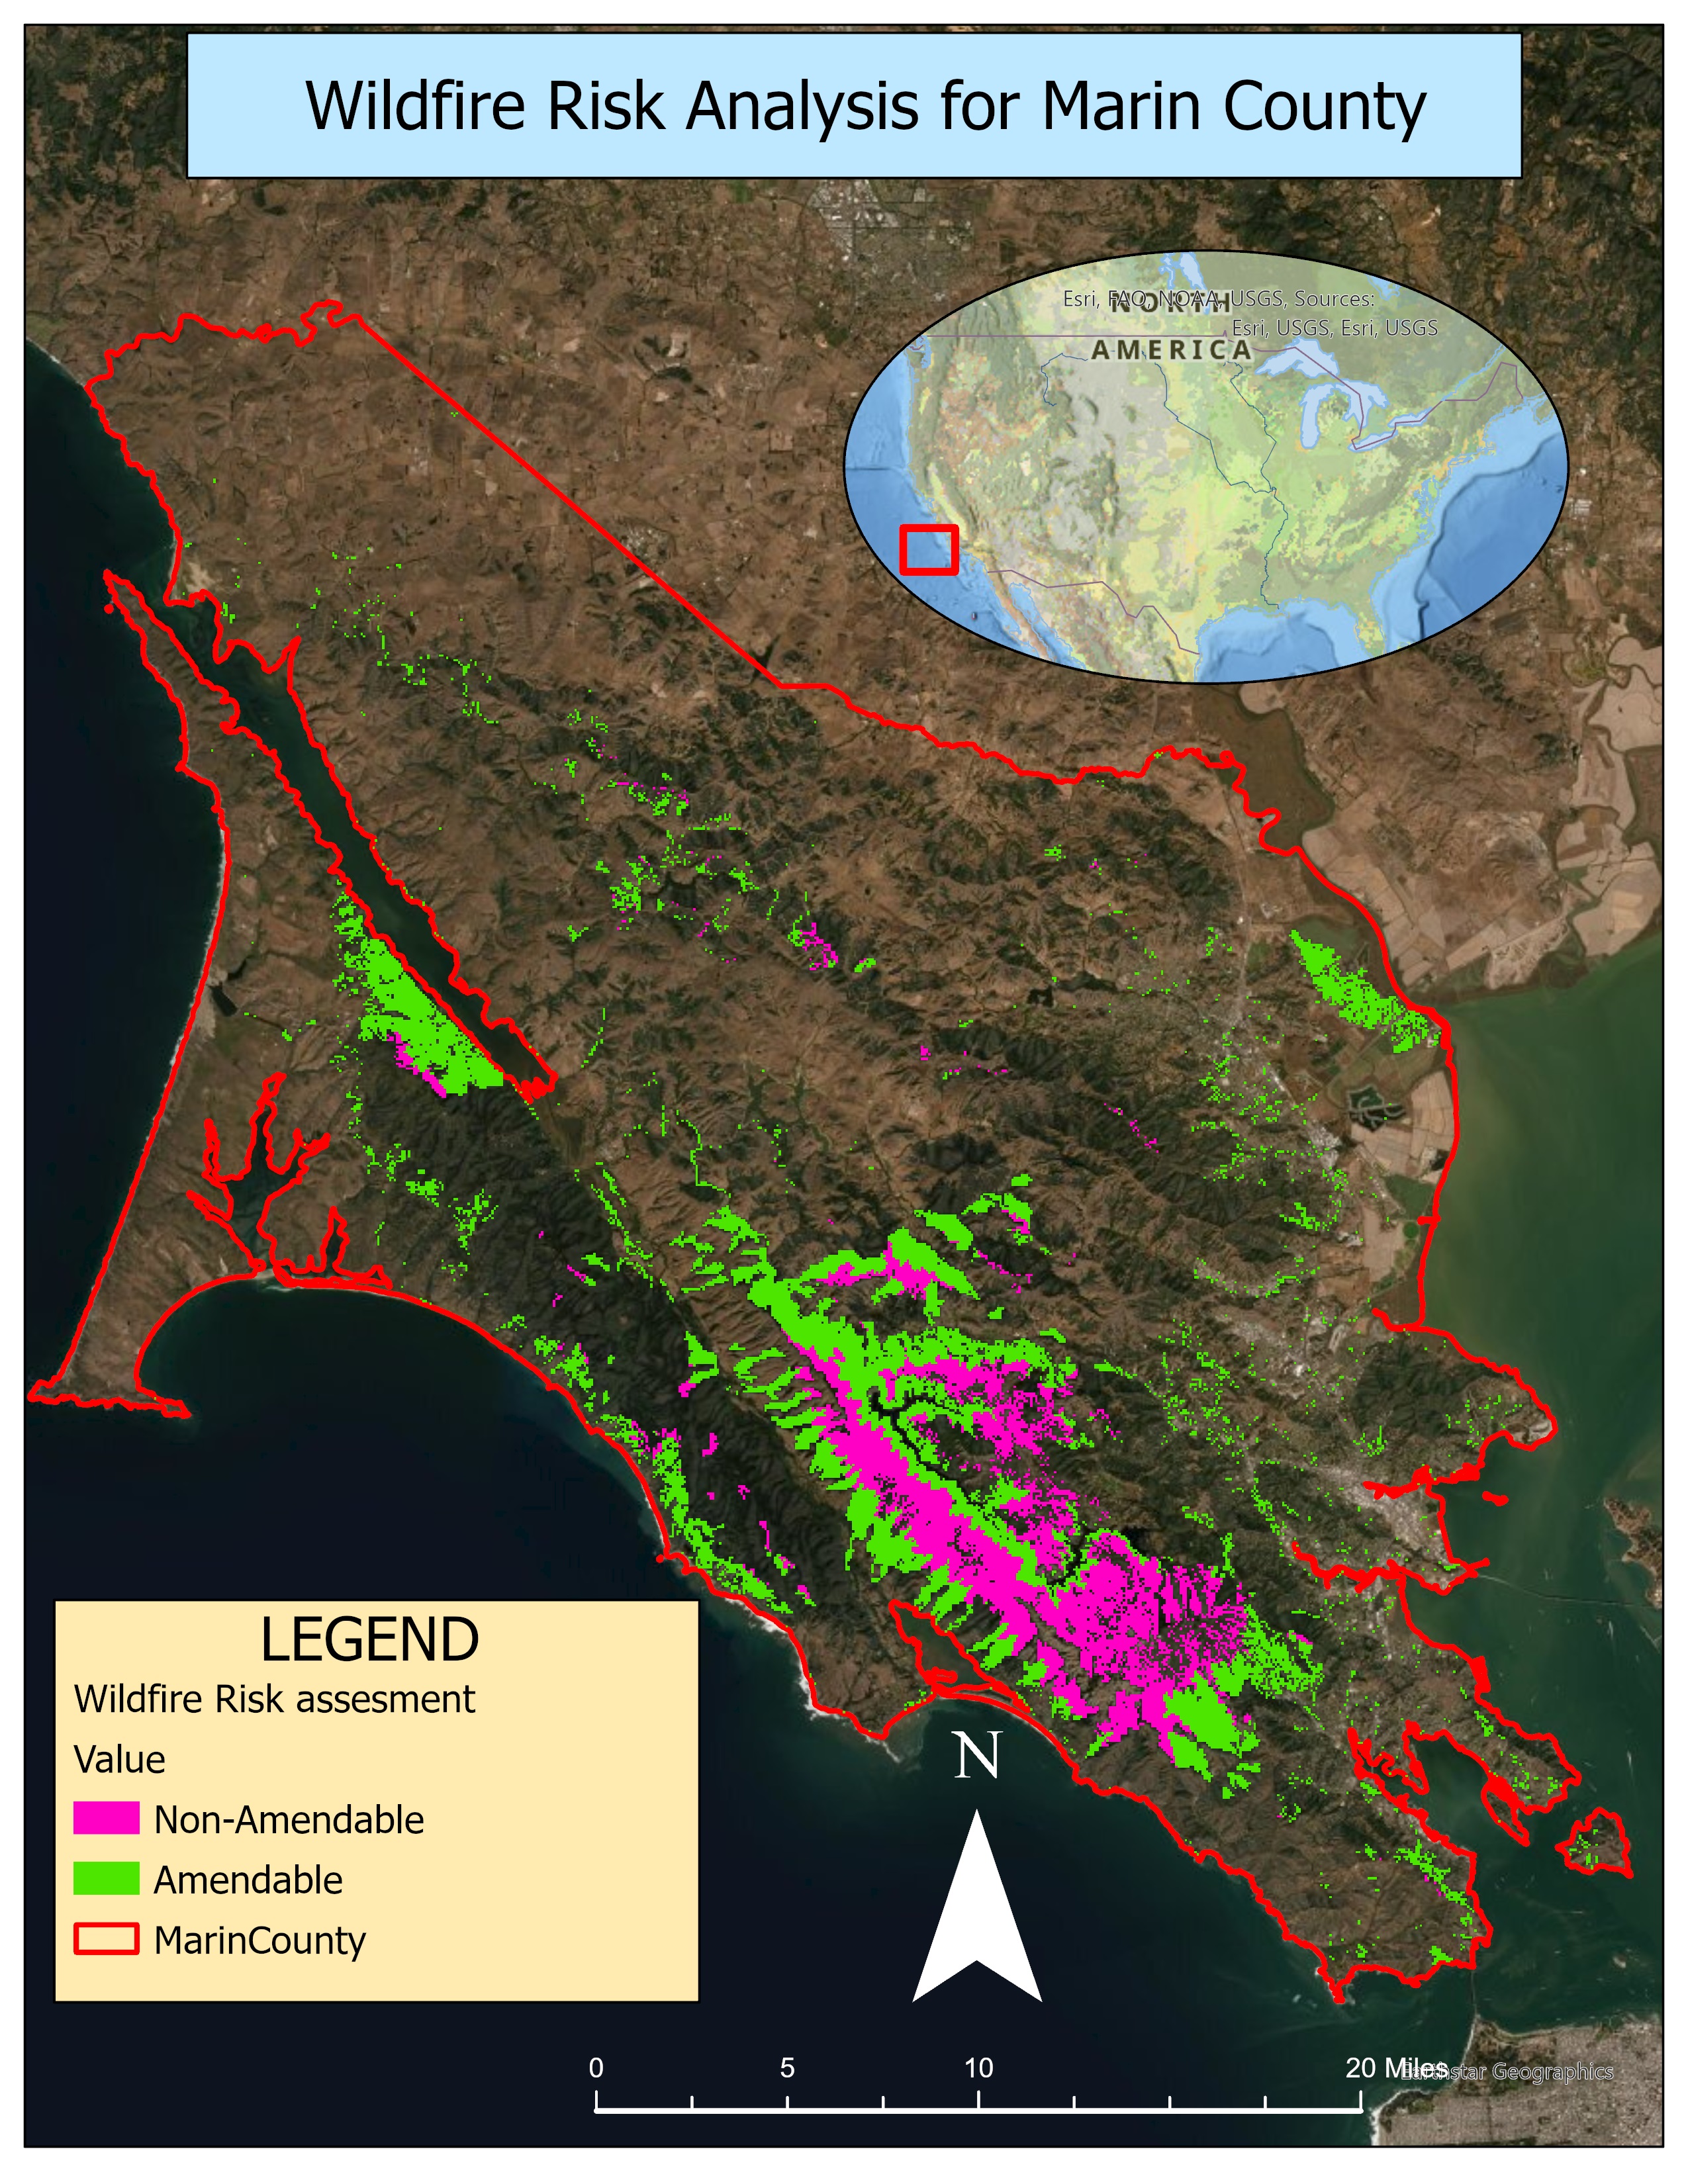
Wildfire Risk Analysis Map
Figure 2 — Wildfire Risk Analysis · All environmental stress factors applied · High-risk zones in southern interior and northwestern Marin County.
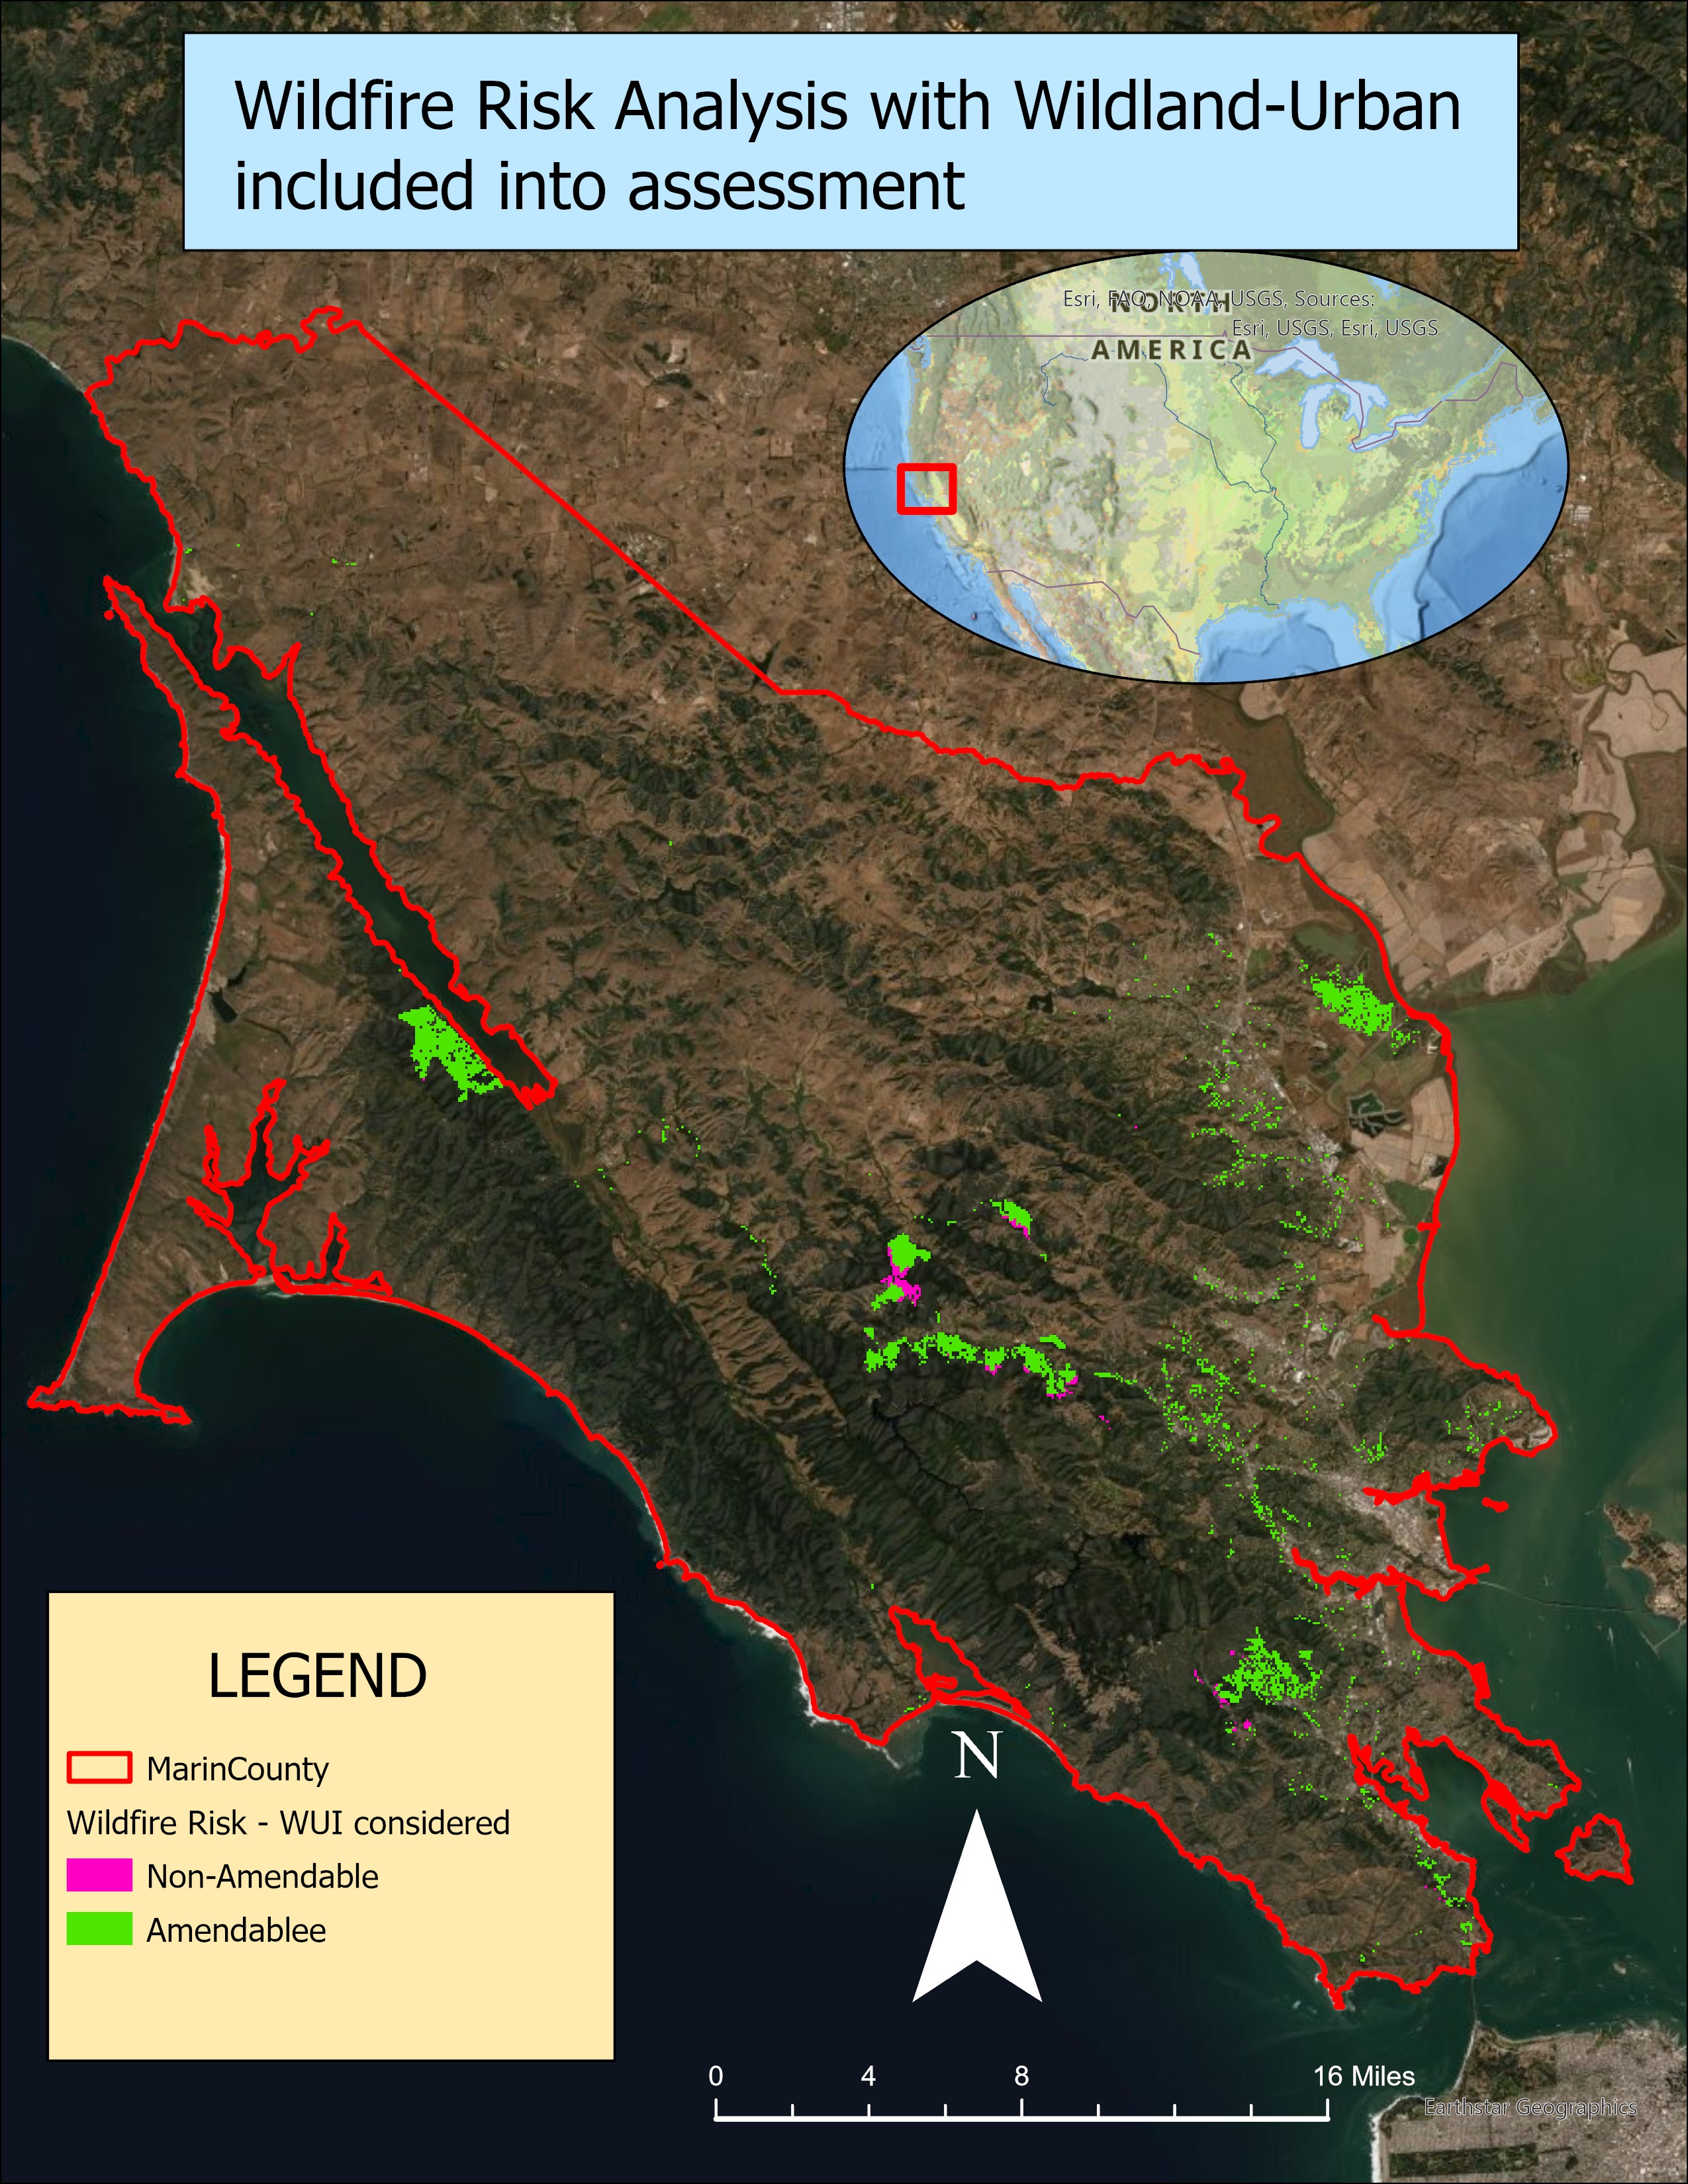
Wildfire Risk with WUI
Figure 3 — Wildfire Risk with Wildland-Urban Interface · Risk refined to populated corridors · Bay coast, southern ridgeline, and northern lagoon regions.
04 — Data Sources

Environmental
Datasets Used

Dataset Source Format Resolution Role in Analysis
Precipitation PRISM Climate Group Raster 4 km Annual precip ≤10% stress threshold
Temperature PRISM Climate Group Raster 4 km High temp ≥19°C stress threshold
DEM / Elevation USGS National Map Raster 1 m Elevation threshold ≤295m (amendable zones)
Wind Global Wind Atlas Raster 100 m Wind ≥7 (>50th percentile) stress threshold
Soil Moisture ArcGIS / USDA NRCS Vector Local Water retention ≤20% (0–100cm depth)
Land Cover Golden Gate NPS Conservancy Vector Local Fire-prone vegetation classification
Drought Index FEMA Vector County-level Severe–Exceptional drought zones
MODIS Thermal Anomalies NASA MODIS Vector Point Fire occurrence validation (2018–2020)
Historical Fire Boundaries Cal Fire / FRAP Vector Local Cross-reference validation (1920s–2020)
WUI Zones Cal Fire / FRAP Vector Local Prioritize high-risk populated areas
05 — Key Findings

Results &
Conclusions

Finding 01 — Environmental Analysis
High-Risk Zones Confirmed by Historical Record
The composite raster analysis identified high-risk wildfire zones concentrated in Marin County's southern interior mountain regions, with additional risk along the northwest and scattered southeastern sections. When cross-referenced against FRAP historical fire boundaries spanning the 1920s through 2020, calculated high-risk areas matched recorded fire locations from multiple decades — semi-confirming that multi-variable environmental analysis can spatially predict wildfire zones.
Finding 02 — WUI Refinement
WUI Integration Refocused Risk to Populated Corridors
Adding the Wildland-Urban Interface layer to the raster calculation shifted the highest-priority risk areas from broad southern zones to the northwest interior mountains, inland bay coastline, and southern ridgeline forest areas — aligning risk output with the areas most critical for emergency management response.
Finding 03 — Linear Regression
Soil Moisture & Land Cover Most Strongly Correlated
Of the seven variables tested, soil moisture and vegetation land cover showed positive statistical relationships with thermal anomaly occurrence. Temperature, precipitation, and drought produced negative coefficients — attributed largely to data resolution limitations at 4km rather than a true inverse relationship with fire.
Finding 04 — NRI Comparison
NRI Accurately Reflects Recent Fires, Not Historical Patterns
FEMA's National Risk Index flagged the county's north-northwest as highest risk — which aligned with 2020 fire locations but diverged significantly from the century-long historical record, where the majority of fires clustered in the southern regions. The NRI's economic-demographic model produces a fundamentally different spatial pattern than ecologically-grounded environmental analysis.
06 — Statistical Results

Linear Regression
Summary

Variable Coefficient Std. Error t-Statistic Probability
Constant 365.74 28.05 13.04 0.000 ✦
Temperature −4.63 1.86 −2.49 0.013 ✦
Precipitation 0.014 0.016 0.91 0.365
Soil Moisture ✦ 0.253 0.389 0.65 0.516
Land Cover ✦ 19.50 6.33 3.08 0.002 ✦
Drought Index 0.522 3.96 0.13 0.895
Wind −4.21 2.22 −1.90 0.059
13.6%
R² — Variance Explained

Interpreting the Results

The R² value of ~13.6% reflects the model's explanatory power given the constraints of available data. Coarser-resolution datasets for temperature and precipitation (4km) and the county-level drought index likely suppressed statistical relationships that finer data would reveal.

Land cover was the strongest statistically significant predictor (p=0.002), while soil moisture showed a positive relationship consistent with fire ecology theory. The researcher noted that higher-resolution drought and climate datasets, combined with machine learning approaches, could substantially improve model performance.

✦ Positive relationship with fire occurrence · ✦ p < 0.05 significant

222
MODIS fire points analyzed across Marin County
A 100-year historical fire record validated against a novel multi-variable environmental analysis — finding that soil moisture and vegetation land cover are the strongest ecological predictors of wildfire in Marin County, while revealing a fundamental disconnect between FEMA's economic-risk model and the county's actual century-long fire geography.
07 — Technical Toolkit

Software &
Methods Used

ArcGIS Pro
Primary GIS platform — raster analysis, clipping, attribute selection, raster calculator, polygon-to-raster conversion, spatial joins, and thematic map production
GeoDa
Spatial statistics platform used for ordinary least squares linear regression of thermal anomaly points against seven environmental variables
Raster Calculator
Boolean multiplication of seven environmental stress rasters to produce composite wildfire probability surface across Marin County
MODIS Thermal Anomalies
NASA MODIS satellite-derived fire detection points filtered to 222 confirmed thermal anomalies within Marin County for 2018–2020
WUI Analysis
Cal Fire / FRAP Wildland-Urban Interface data integrated to refine risk outputs toward populated areas requiring priority emergency response
FEMA NRI Validation
National Risk Index compared against environmental analysis outputs and historical fire boundaries to assess model accuracy and limitations
Interested in
this research?
GIS Engineer & Geospatial Scientist · Portland, Oregon · Open to new roles